Kaplan-Meier (mixture model) plots on Breast Cancer 1 (AQUA)
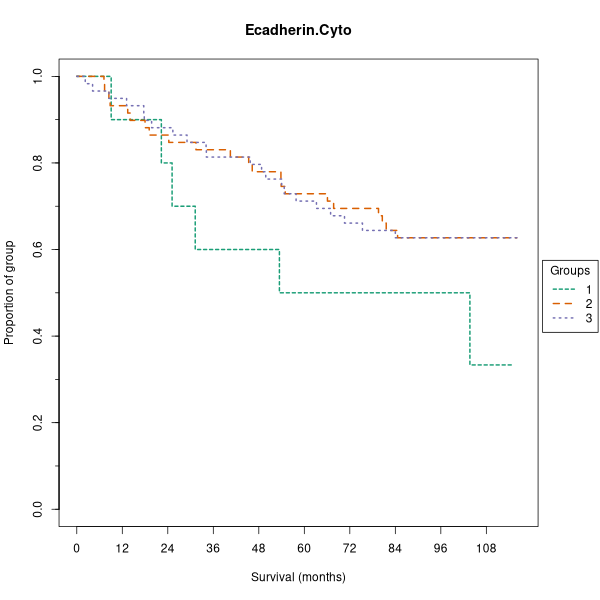
Ecadherin.Cyto
Log-rank Chi-sq:
2.323
FDR corrected p-value:
0.6372
Mean silhouette width:
0.5688
Group 1:
n: 10
Min: 433.72
Median: 684.36
Max: 1215.42
Group 2:
n: 59
Min: 1880.38
Median: 3165.39
Max: 3752.52
Group 3:
n: 59
Min: 3820.93
Median: 4384.34
Max: 5508.06
Ecadherin.Cyto (Kaplan-Meier (mixture model) plots on Breast Cancer 1 (AQUA) dataset)

Ncadherin.Cyto

A Kaplan-Meier plot is not available for this marker. This is most likely because the mixture model is unimodal (it only contains one group). It may also be because there are too few distinct values to generate a mixture model.
Bcatenin.Cyto

A Kaplan-Meier plot is not available for this marker. This is most likely because the mixture model is unimodal (it only contains one group). It may also be because there are too few distinct values to generate a mixture model.
Bcatenin.Nuc

A Kaplan-Meier plot is not available for this marker. This is most likely because the mixture model is unimodal (it only contains one group). It may also be because there are too few distinct values to generate a mixture model.

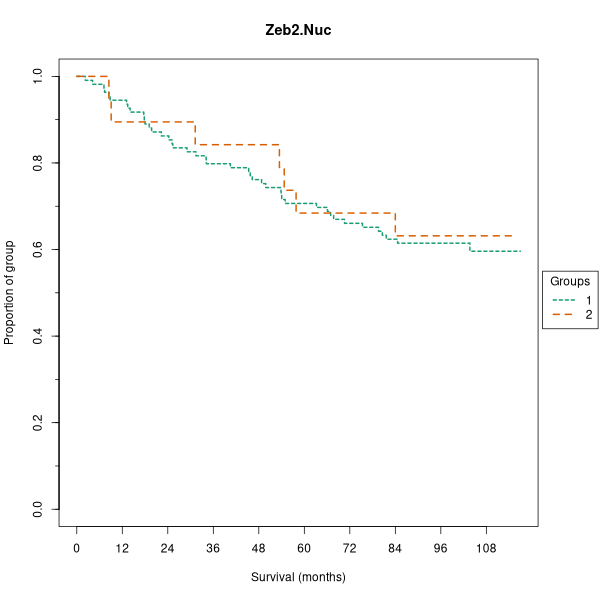
Zeb2.Nuc
Log-rank Chi-sq:
0.06059
FDR corrected p-value:
0.9618
Mean silhouette width:
0.6667
Group 1:
n: 109
Min: 122.26
Median: 210.86
Max: 297.03
Group 2:
n: 19
Min: 317.36
Median: 364.53
Max: 691.99
Zeb2.Nuc (Kaplan-Meier (mixture model) plots on Breast Cancer 1 (AQUA) dataset)
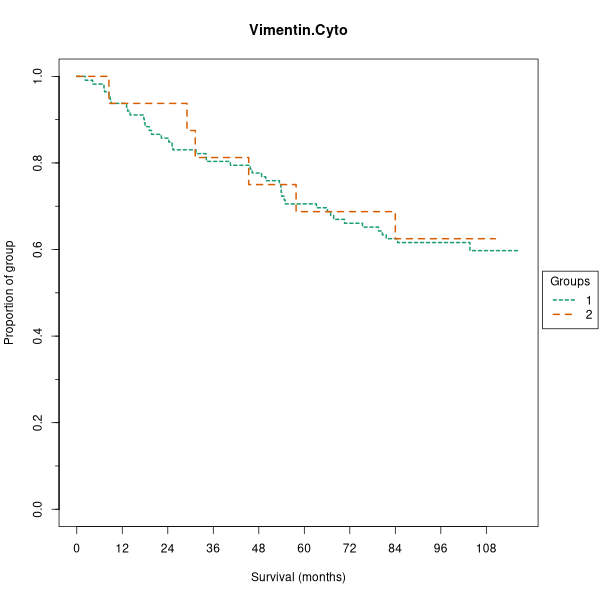
Vimentin.Cyto
Log-rank Chi-sq:
0.02873
FDR corrected p-value:
0.9618
Mean silhouette width:
0.7767
Group 1:
n: 112
Min: 625.98
Median: 1151.95
Max: 1881.14
Group 2:
n: 16
Min: 1911.38
Median: 2891.31
Max: 5413.05
Vimentin.Cyto (Kaplan-Meier (mixture model) plots on Breast Cancer 1 (AQUA) dataset)

SNAIL.Nuc

A Kaplan-Meier plot is not available for this marker. This is most likely because the mixture model is unimodal (it only contains one group). It may also be because there are too few distinct values to generate a mixture model.

SLUG.Nuc

A Kaplan-Meier plot is not available for this marker. This is most likely because the mixture model is unimodal (it only contains one group). It may also be because there are too few distinct values to generate a mixture model.

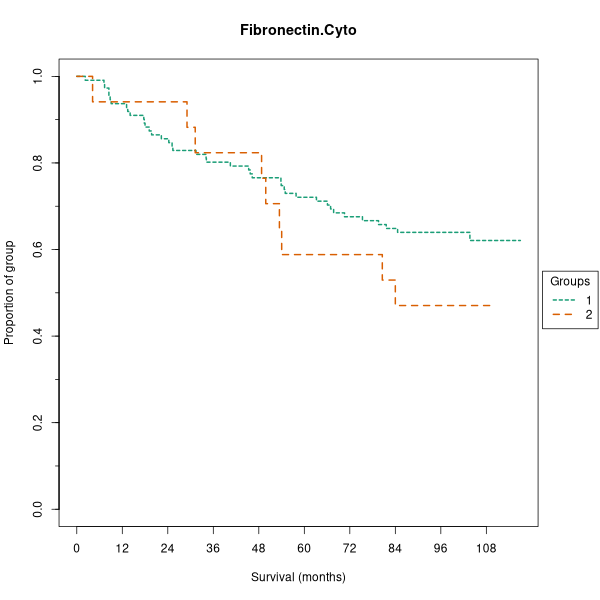
Fibronectin.Cyto
Log-rank Chi-sq:
1.23
FDR corrected p-value:
0.6683
Mean silhouette width:
0.6962
Group 1:
n: 111
Min: 87.23
Median: 284.29
Max: 547.97
Group 2:
n: 17
Min: 570.51
Median: 802.20
Max: 1356.76
Fibronectin.Cyto (Kaplan-Meier (mixture model) plots on Breast Cancer 1 (AQUA) dataset)
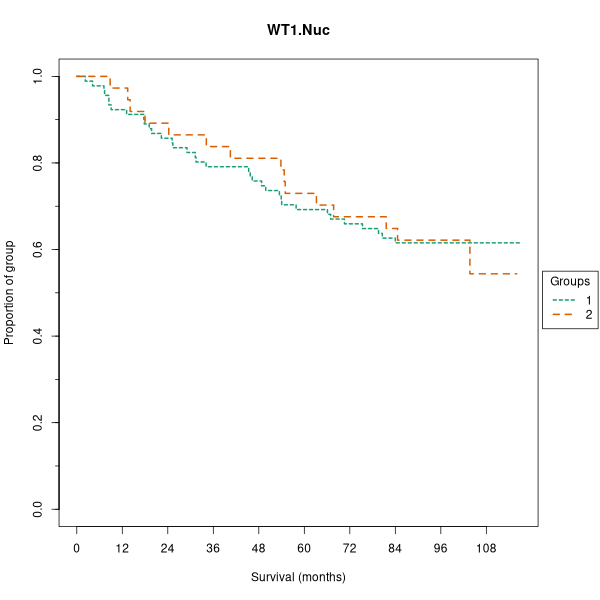
WT1.Nuc
Log-rank Chi-sq:
0.002298
FDR corrected p-value:
0.9618
Mean silhouette width:
0.5848
Group 1:
n: 91
Min: 465.15
Median: 1266.75
Max: 1870.89
Group 2:
n: 37
Min: 1879.64
Median: 2232.51
Max: 4070.16
WT1.Nuc (Kaplan-Meier (mixture model) plots on Breast Cancer 1 (AQUA) dataset)
x

#{text}


Please select a file containing marker scores. Be sure to check the file formatting requirements first.