

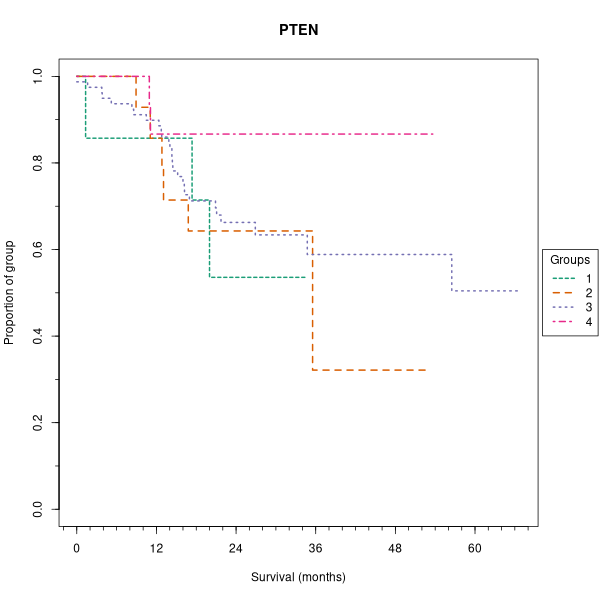
pAKT.nuclei
A Kaplan-Meier plot is not available for this marker. This is most likely because the mixture model is unimodal (it only contains one group). It may also be because there are too few distinct values to generate a mixture model.
pAKT.cyto
A Kaplan-Meier plot is not available for this marker. This is most likely because the mixture model is unimodal (it only contains one group). It may also be because there are too few distinct values to generate a mixture model.
HER2
A Kaplan-Meier plot is not available for this marker. This is most likely because the mixture model is unimodal (it only contains one group). It may also be because there are too few distinct values to generate a mixture model.
